BI
Hiding OTBI Root Folders
A new support doc was released on Christmas Eve last year (which may be why I missed it at the time!) describing how to implement functionality delivered via an Enhancement Request. This functionality gives us back the ability to hide root folders within OTBI.
First, a bit of history. A couple of years ago (in release 18A) Oracle removed the ability for customers to ‘modify the shipped BI catalogue content’. This meant we were stuck with the root folders for all Oracle products, even if a customer only purchased one of them:

Although end users who aren’t report authors / power users shouldn’t really be browsing around the catalogue (see this post: Surfacing Reports to End-Users) it’s untidy and confusing.
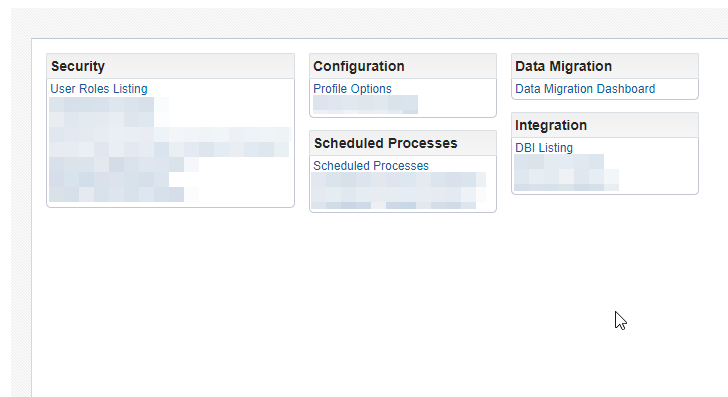
Happily, Enhancement Request 28108026 was implemented with Release 19d which allows us to provide a tidier solution to any of users who have BI Consumer but do need access to all folders:

Details on how to implement this can be found in Doc 2412231.1.
Caveat 1: This only works for BI Consumer. Users who have BI Platform Author and BI Administrator still see the full list.
Caveat 2: I’ve not been able to remove the Extension root folder yet and have an SR raised for assistance.
Surfacing Reports to End-Users
We shouldn’t be expecting end-users to navigate the Reports & Analytics catalogue to find reports, especially now the ability to hide folders that are irrelevant to HCM / ERP Cloud has been removed.

The easiest option is to create a simple dashboard (or set of dashboards) containing the reports instead. You can embed the actual report output, however that takes a bit more planning, so a quick solution is to just have links to the reports in sections.
Something as basic as this is a good start, and gives end-users single-click access to reports without having to hunt through the catalog.
If you want to get a little more sophisticated, each section can have its own set of permissions so end-users only see the sections within the dashboard that are appropriate for them.
Creating the page and tile for the dashboard in the application takes a few minutes, and the dashboard itself can be added to incrementally as your report suite grows without needing to re-personalise the page.
Visualising Transfers on a Sankey Chart
Earlier this month I posted a method of getting a Doughnut Chart in HCM Cloud despite only the traditional pie chart being supported – with the cunning use of Google Charts, as first shown by Damien Roux and Julian Challenger.
Google Charts can do a lot more than just doughnuts though. Have a look at Gallery 1 and Gallery 2 for a broader range.
One that particularly caught my eye was the Sankey Chart, which I thought would be an excellent way of visualising Global Transfers in your organisation. It took a little fiddling and some Logical SQL to get the data just right, but displaying the data by calling out to Google Charts is essentially using the same method as Damien/Julian first did.
Here’s my Sankey Chart showing the transfer of workers around an organisation (LE names on the chart are blurred):

Pretty sweet huh?
Doughnuts and HCM Cloud
Today is – apparently – National Doughnut Day, so here’s a very tenuous way of talking about Oracle HCM Cloud within the context of doughnuts.
A couple of months back I tried to find a way of getting doughnut charts within OTBI in HCM Cloud, as they look more modern than a traditional pie chart. I couldn’t find a way so posted in Oracle’s Cloud Customer Connect site and learnt two things:
a) doughnut charts are not yet supported in OTBI, and
b) pie/doughnut charts are a poor choice of visualisation in almost every circumstance
I temporarily abandoned my quest and it was only while looking at another post on Headcounts on a World Map featuring some excellent work by Damien Roux and Julian Challenger that I realised that they are calling out to Google Charts from within OTBI. I had a look at the available chart types in the Google Charts Gallery and lo-and-behold, there’s a doughnut chart!
Using the same techniques as Damien and Julian (using the Google Charts javascript within a Narrative view) it was relatively trivial to get a simple doughnut chart within OTBI:
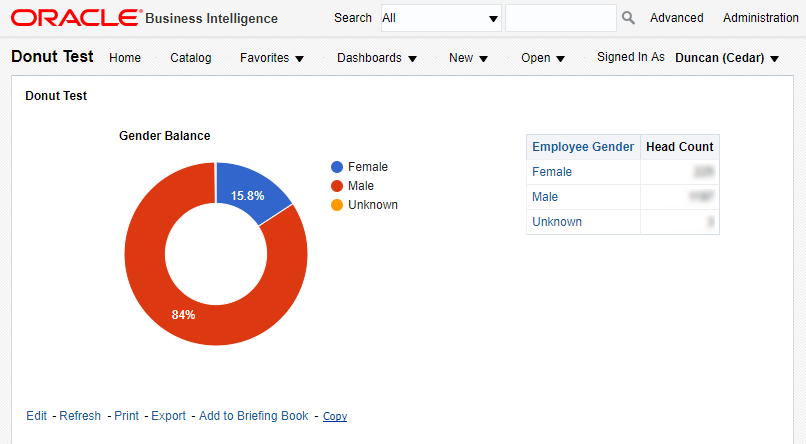
Happy Doughnut Day!
Footnote:
Google Charts can do a lot more than just doughnuts and maps. Have a look at Gallery 1 and Gallery 2 for a broader range.
OTBI and Unusual Number Formats
At one of our clients we’ve exposed a number of infolets to employees to give them information about sicknesses, vacation etc. One of these infolets lists the holiday balances an employee has left.
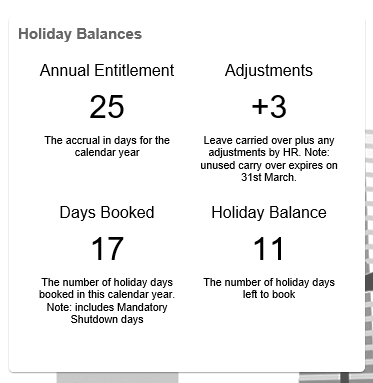
The upper right figure shows the carryover from the previous holiday year plus any adjustments that HR have applied. As an adjustment could be positive or negative the client wished to always display the sign against the number, not just to show the minus sign when it was a negative adjustment (which is OTBI’s default).
The quickest way to achieve this was to apply a custom number format mask to the field.
Most people will be familiar with using a mask such as ###,###,##0.## where the hash is for an optional digit – so the data doesn’t pad with unnecessary zeroes – however you can use similar principles to force a plus sign in front of positive numbers.
The two mask techniques to combine are using ” ” around literals and using a semi-colon to split positive and negative number formats.
This means the mask:
“+”##0.##;“-“##0.##
will use the blue part (with the prefixed ‘+’) for positive numbers and the red part (with the prefixed ‘-‘) for negative numbers.
The documentation for this can be found here:
https://docs.oracle.com/cd/E28280_01/bi.1111/e10544/format.htm#BIEUG13084
however I found that the quotes were not necessary and the mask +##0.##;-##0.## worked fine.
What’s new in Release 12 for OTBI
There’s a lot to like about the improvements in the imminent release 12 applications, however one of the largest jumps forwards is with OTBI – the ad-hoc analysis tool within the Oracle Cloud. Last week I attended a great webinar from Oracle on the enhancements that R12 introduces.
New Subject Areas
As with every release, Oracle have introduced some new subject areas:
Workforce Learning – Learning Management Real Time
For the new learning application you can see which is the most popular learning item, or which is the toughest to complete or who produces the most learning content.
Payroll – Payroll Balances Real Time
Reporting on payroll balances (also back-ported to R11). This enables access to all elements and deductions, and can report on all payroll runs.
Workforce Talent Review – Talent Review Tasks Real Time
Allows reporting on tasks during the talent review cycle, to track the progress of tasks eg. what percentage of workers have completed certain tasks.
Human Capital Management – Approval Notification Archival Real Time
Allows reporting on task approvals that have been completed. There is a time dimension so this is ideal for tracking the number of approvals within certain periods.
Enhancements to existing Subject Areas
Reporting on Managers of Terminated Workers
This is something that has been an issue for one of Cedar’s clients, and this fix will be warmly received by them.
Work Relationship Real Time – Non Primary Work Relationships
Non-primary work relationships now show.
New Dimension – Parent Manager
Within the worker dimension within all subject areas, we now have a number of parent manager name and number fields, allowing us to see the complete manager hierarchy.
New Dimension – Person Schedule Assignment
Allows reporting on an employee’s Work Schedule. This will also be warmly received as we’ve had to create BIP reports for this previously.
New Dimension – Person Schedule Assignment Exception
Allows reporting on exceptions to schedules.
New Dimension – Review Period
Under Performance and Goals, we can now report on the periods associated with performance review.
New Dimension – Criticality
Allows reporting on how critical a job or position is.
New Dimension – Previous Employment
Can contain the worker’s previous employer and the details of that employment.
New Dimension – Talent Score
Exposes the rating scores awarded during a Talent Review meeting.
New Dimension – Technical Post
Report on an employee’s technical posts.
New Dimension – Benefit Legal Disclaimer
Report on Benefits Enrollments that have happened with or without legal disclaimers.
New Dimension – Benefit Person Habits
Tobacco type usage, disability status, medical plan.
New Dimensions – Qualification Plan Participation, Certifications
Enhanced Dimensions – Person Profile Real Time
Added attributes within Licences and Certs, Risk of Loss and Special Projects.
Enhanced Dimensions – Person Names
Additional attributes to allow more names for a worker.
OBI EE Enhancements
Subject Area Search
This is going to save a fair amount of time for those getting up to speed with what’s in each Subject Area.
Save Column As
Easily clone a column. Formatting and formulae are preserved.
New Print and Export Options
HTML 5 style
The default graph style has changed from Flash to HTML5.
Introducing OTBI-E
Today I was lucky enough to attend a pre-release workshop for OTBI-E (Oracle Transactional Business Intelligence for the Enterprise). The product is currently in controlled release but is going to be generally available very soon.
What is OTBI-E?
OTBI-E fills the gap between OTBI Standard (which is more operational in nature, reporting against the transactional database and for line managers to perform real-time BI) and the full OBIA (which is a fully-fledged data warehouse solution, delivered on-premises).
OTBI-E takes most of the power from the OBIA data warehouse solution and brings it to the cloud, allowing you to perform complex, strategic BI against your HCM and Talent Cloud apps, plus 3rd party apps (PeopleSoft, EBS, Siebel) and other external sources (i.e. public data). As it’s a DW solution you get full access to historical data to perform trend and predictive analysis (something which is apparently quite weak in some competing products).
Show me OTBI-E
There’s a video available here:
Which BI Solution is right for me?
The answer to this depends upon a number of factors, however here’s a quick decision tree to show some of the factors involved:

(click for bigger)
