Manage your SRs better – for free!
I’ve just finished a role where I spent 7 months as the Service Delivery Manager for one of our larger clients. One of the key factors to being successful was ensuring the team had Oracle SRs under control. I don’t find it particularly easy to get an summary of the SR situation by looking at the screen in MOS (My Oracle Support) – you can order the columns but it’s difficult to get an overall view of progress. There’s also the SR dashboard, but that doesn’t work if you look after multiple accounts – as many of us will do.
The solution – as I suspect many of you do – is to drop the data out to Excel to analyse. As it’s something I would be doing frequently I wanted to automate as much as possible in order to be efficient. I’m making my SR Dashboard spreadsheet available in case others find it useful.
Step 1 – Import raw data
The first tab of my SR Dashboard spreadsheet is where I paste the raw data from MOS. You need to make sure the columns are in the right sequence (Problem Summary, Technical SR#, Contact, Severity, Status, Last Updated, Opened, then whatever else you need), then just Export to Excel:

In the ‘Raw Data’ tab on the SR Dashboard spreadsheet, clear out the existing data and paste in everything from your export from MOS.
Step 2 – Inspect the ‘SR List’ tab
The ‘SR List’ tab in the SR Dashboard takes the lines from the ‘Raw Data’ tab, formats it nicely and contains some formulae to display the data better. You don’t need to change anything on this tab, just perform a visual inspection to make sure it looks ok. If there are issues it may be your columns weren’t in the right order or the copy and paste of data didn’t work right.
EDIT: Also see Marc’s comment below if your dates are not coming through in the right format causing the Age formula to break.

Step 3 – Enjoy the Dashboard
Now view the Dashboard tab. On the Excel ribbon at the top select Data, then Refresh All:

Your SR data will now be summarised and displayed nicely. Clockwise from top left the charts show (1) SR Status – the count of SRs by the SR status, (2) SR Age – the count of SRs within each age bracket, (3) the oldest and newest SRs, and (4) SR Owner – who in your team has the most open SRs. Additionally, all the data in the charts is colour-coded by severity so you can see the status of your most critical SRs.
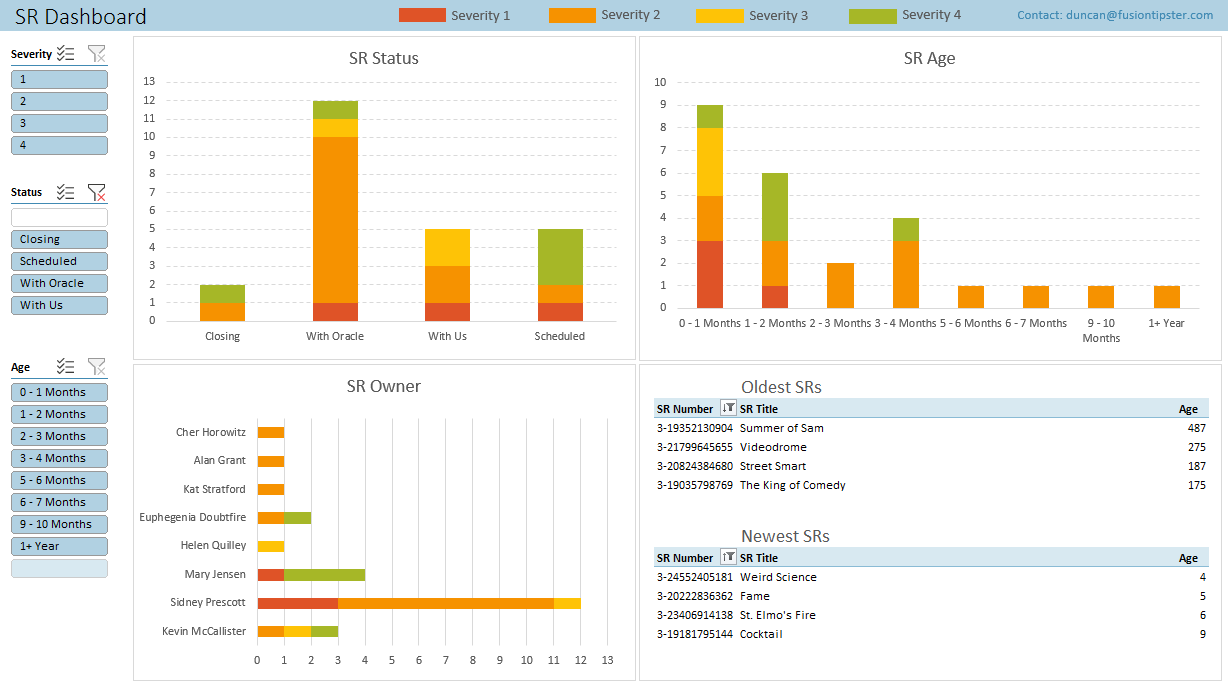
As an additional aid, the Slicers on the left allow you to filter the data displayed. Do you just want to view your Sev1 and Sev2s? Or maybe you just want to see the owners of your oldest SRs? Or maybe exclude SRs which are closing or scheduled? Just use the slicers and the charts update allowing you to further analyse the data:

You might need to tweak it a little if your screen resolution is different to mine. I’d also be interested to hear if you enhance it in any way or have other feedback. Some of the more advanced functionality (slicers, and some formulae) may not work in older versions of Excel.
If you want to try it for yourself the SR Dashboard file can be downloaded here:
3 thoughts on “Manage your SRs better – for free!”
Comments are closed.

February 4, 2021 at 2:02 pm
I had to set the the value for ‘Auto Detect Timezone’ to ‘On’ in under ‘Personalization’ in the ‘Settings’ tab of MOS. Then the table worked. The dates are in the wrong format for the forumlas of Age(Days) and Freshness(Days) to work if the ‘Auto Detect Timezone’ setting is not set to ‘On’. That was at least the case for me.
I am going to use this, Duncan. Thank you, Sir!
February 4, 2021 at 2:32 pm
Good detective work. Thanks buddy!
February 4, 2021 at 3:02 pm
great stuff and quite useful to manage the volume of SRs. Thank you Duncan.