Monitoring Oracle Cloud Users – Heatmaps and Recordings
Earlier this week I mentioned a new service I’ve found which enables better monitoring of your Oracle Cloud Users and showed the dashboard and analytics it provides. Today I’m going to look into the HeatMap and Recording functionality.
Heatmaps
A heatmap allows you to see a composite view of all your users’ activity on one screen by overlaying it with colours to represent the most frequently clicked areas.
Using these heatmaps you can identify which are the most used pages and common navigation paths, and which areas are not being accessed by users – so you can introduce measures to increase adoption.
Recordings
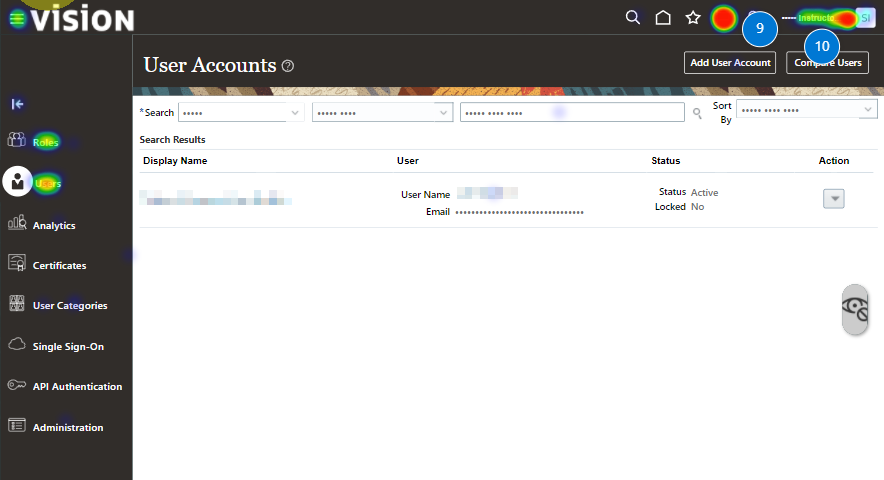
Sessions are also recorded and can be played back later. Your first reaction to this is likely the same as mine – “what about GDPR?!?!” – however the data is masked to mitigate the risk of PII data being displayed. You can also tweak the masking settings to make the obfuscation more aggressive.
Here you can see the playback of a recorded session with progress bar at the bottom for quick navigation, and the cursor path and mouse clicks highlighted on the screen.
The real use-case here is you can use the dashboard to narrow the results down, and then follow the recordings of just those. For instance, you could filter by just those sessions encountering JavaScript errors and then view those playbacks – really useful for troubleshooting user issues and evidencing issues to Oracle.
