Fusion and Oracle Analytics Desktop
In this age of moving everything to the Cloud I tend to pay a bit less attention to desktop offerings than I previously used to, however a LinkedIn article from Philippe Lions shared by Santosh Kumar Bhairi about Oracle Analytics Desktop caught my eye.
It’s a product I’d not heard of before, but after a bit of research I discovered it’s a program that allows you to connect into all types of data sources and quickly visualise your data. I downloaded it to give it a whirl.
First, you select the Connection to where your data resides. There are about 50 options, and happily Oracle Cloud Apps is one of them:

Next you build your Data Set. It gives you all of the subject areas in OTBI plus all of the Analytics you’ve built to choose from. It also looks like it lets you enter Logical SQL (although I didn’t try this). It doesn’t appear you can enter raw SQL against the database (yet) however.
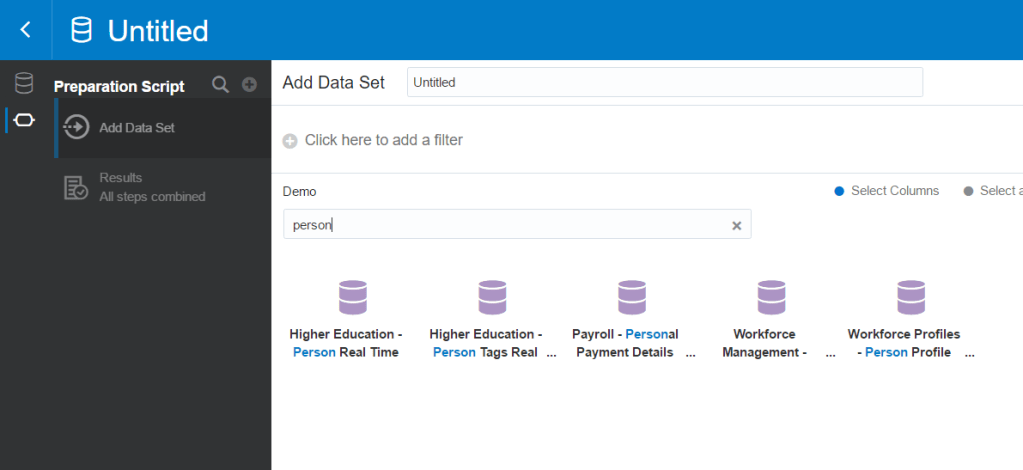
Once you select your Subject Area(s) you then select the Attributes and Measures, giving you sample data at the foot of the screen:

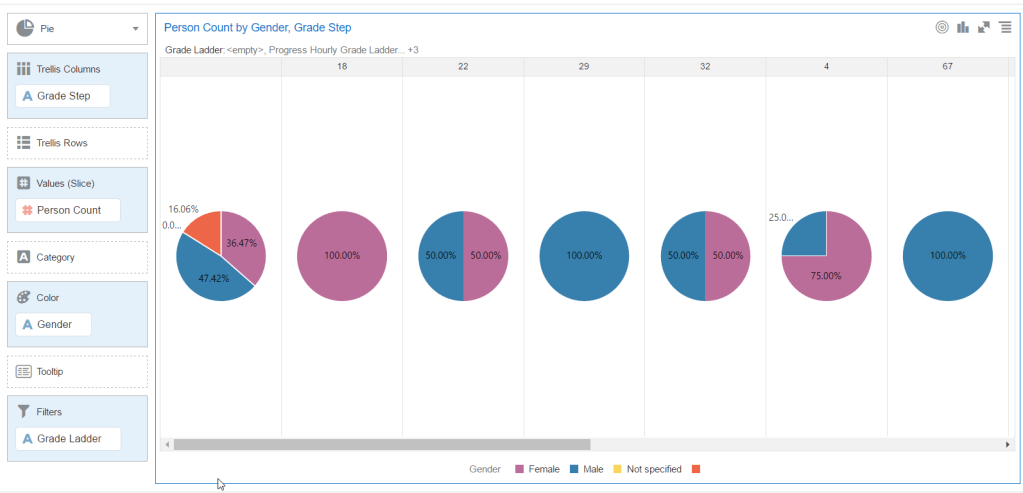
Once that’s done, you can start visualising your data. There are some automated / recommended charts, however it’s dead simple to select your chart type and drag the data fields on. Within a couple of seconds I’d whipped up charts showing gender by grade:
And a quick headcount / map chart:

These aren’t very revealing as they’re based off the Vision demo data, however you can get from clicking ‘download’ to generating some pretty nice charts in less than an hour.
I understand that for training and evaluation purposes you can use it for free. Read more about it here.
